
Viin Cohort View
by Viindoo
| Lines of Code | 1521 |
| Technical name | viin_web_cohort |
| License | OPL-1 |
| Website | https://viindoo.com/apps/modules/19.0/viin_web_cohort?force_show=1 |
| Read description for | v 13.0 v 14.0 v 15.0 v 16.0 v 17.0 v 18.0 |
| Extensions | Viin CRM Cohort View Test |

See who stays - cohort by cohort
Turn any Odoo model with a start date and an end date into a retention and churn analysis - one view declaration, no custom development, no export to a spreadsheet.
Viin Cohort View (technical name viin_web_cohort) is an Odoo 19.0 app for Odoo Community and Viindoo, built for sales managers, inventory managers, analysts, and management.
viin_web_cohort itself ships no menu, action, or business model of its own - the screens below come from a companion example module used to illustrate the view.
At a Glance
The facts of Viin Cohort View, version 0.1, in one place. Published by Viindoo.
base, ir.ui.view, ir.actions.act_window.view)How It Works
Declare the view once; read it as retention or churn, at the interval that matches your business.
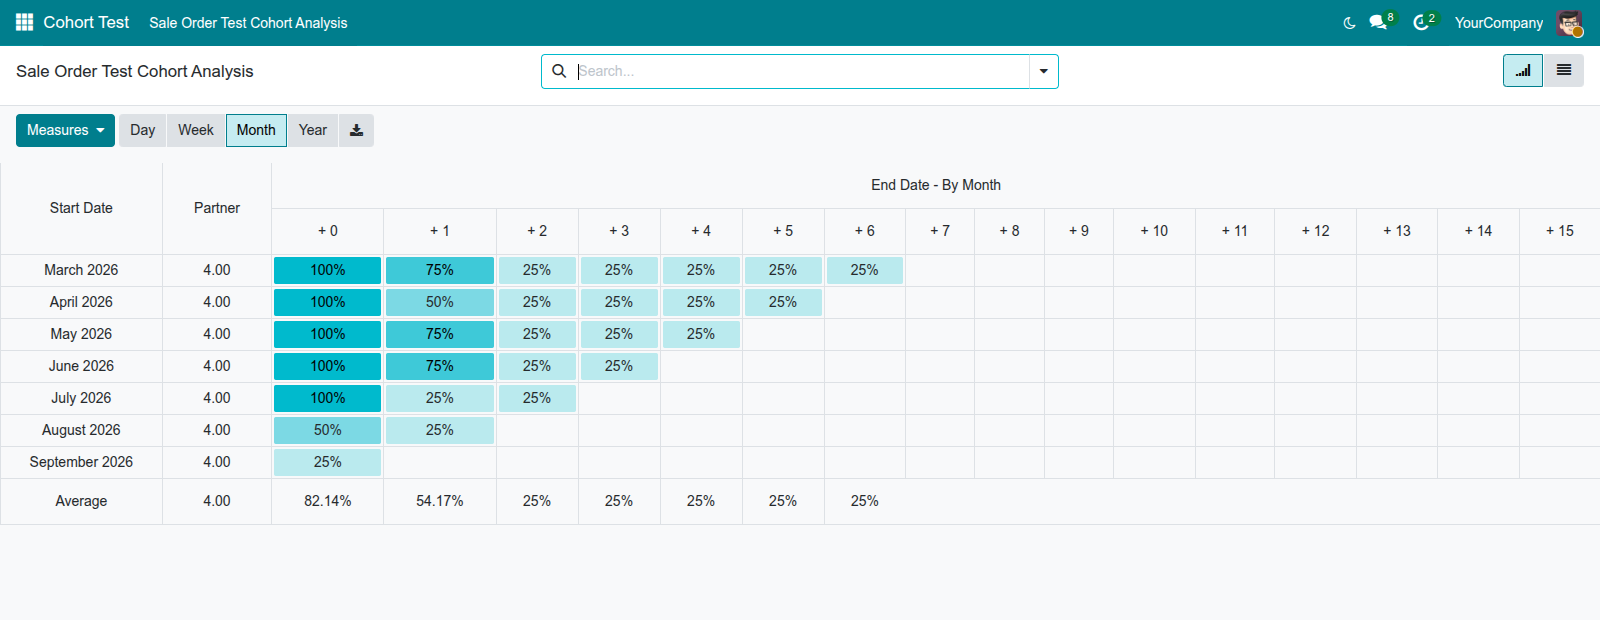
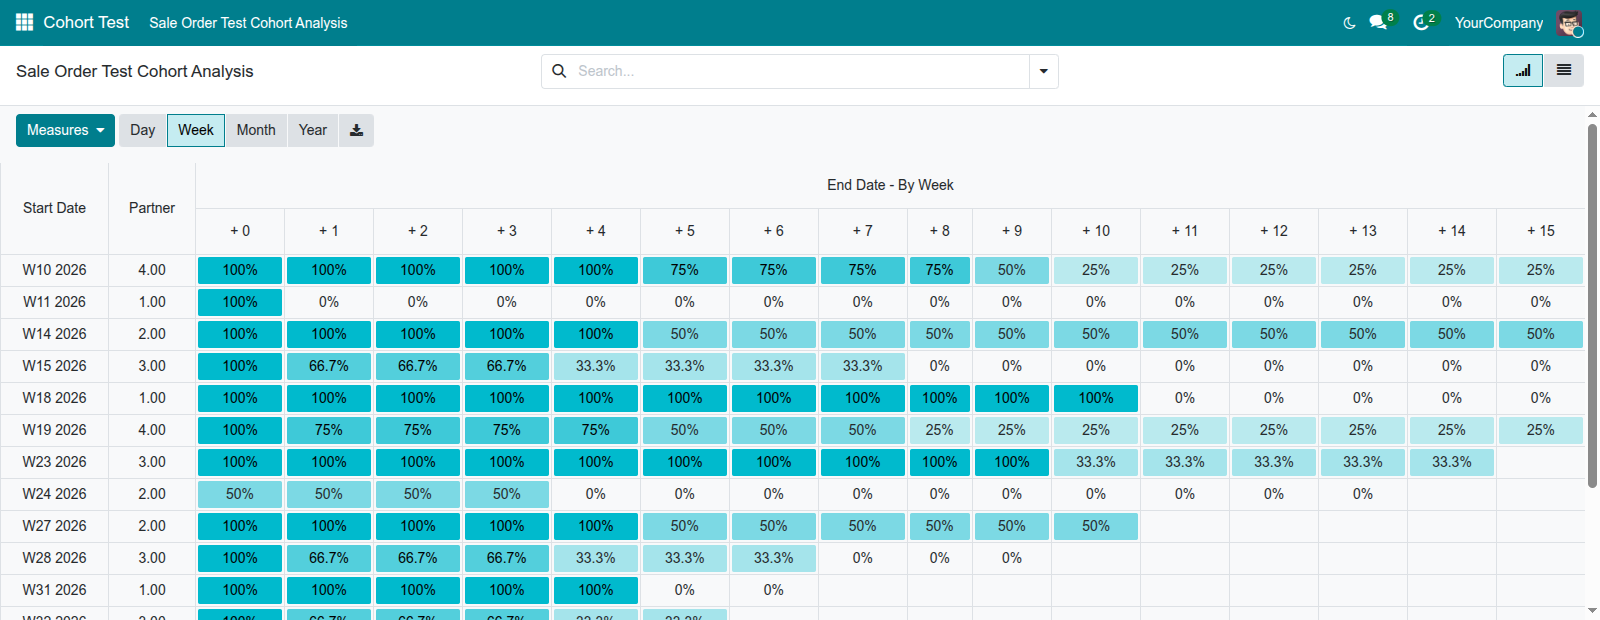
Retention or churn, at your period
Read the same data as retention or as churn, and switch between day, week, month, or year grouping on screen, without leaving the report.
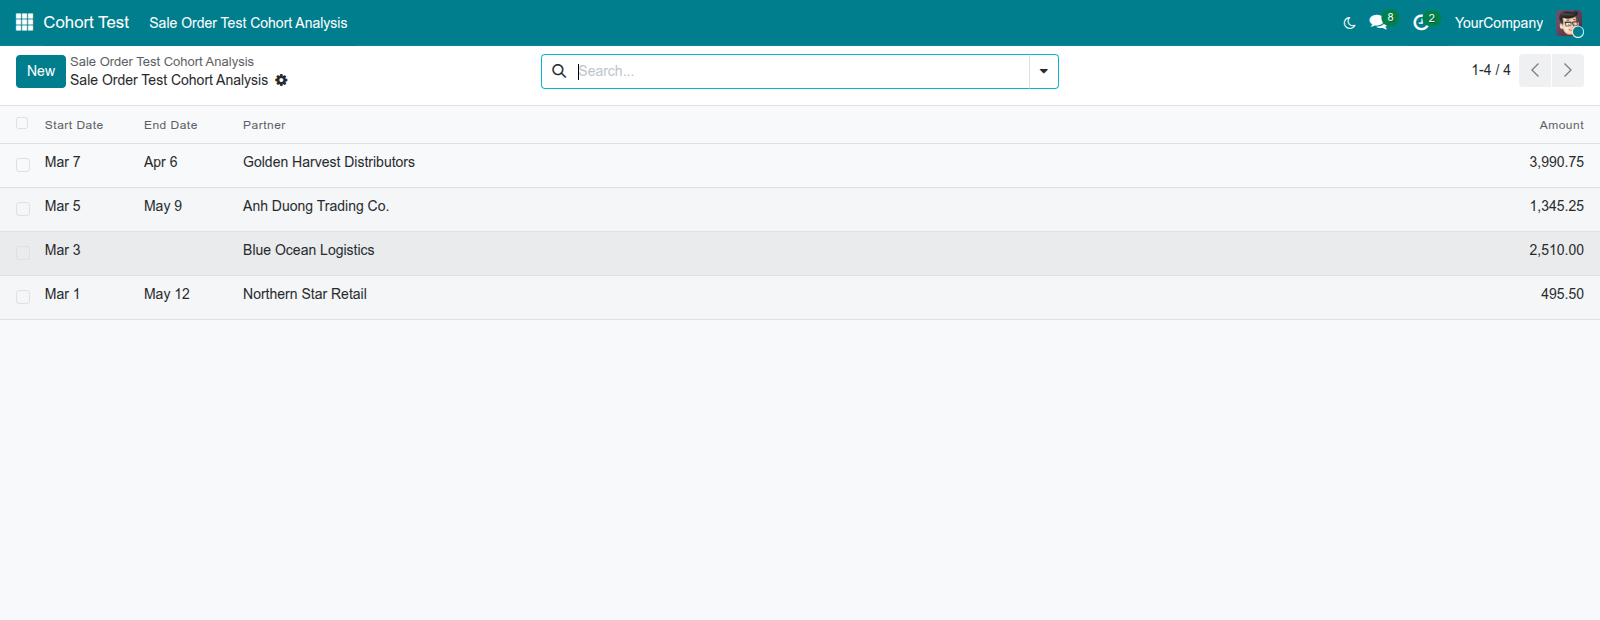
Every percentage is auditable
Click a cell and the report opens the exact records behind that number, with your current search filter still applied.
Count what actually matters
Measure record counts, a distinct linked record, or the aggregate of any numeric field - revenue, quantity, hours - using that field's own aggregation.
What You Get
Works on any model you already have - no separate report to design
One view declaration, validated by Odoo when it is saved
Drops into any window action alongside list, form, and kanban
Interactive table: switch measure, interval, and reading on screen
Click-through from any percentage to its underlying records
Export the exact table on screen to xlsx in one click
More Screens
Everything below was taken on a database seeded with real business data, on this series - not a mock-up and not a screenshot from an older version.
Export to xlsx
What This App Does Not Do
Read this before you buy. Everything below is something the app deliberately leaves to another app or to you.
What it shows depends on the model and the measure you pick.
A cohort without a start period is not a cohort.
You (or another app) declare the view on the model you want analyzed.
That is the measure you choose when you declare the view.
Works Well With
Other Community view types from the same stack:
Who Should Use Viin Cohort View?
Sales manager
Sees whether a month's new customers came back.
Inventory manager
Watches how a period's stock behaved over the months after.
Analyst
Gets the one view Community was missing.
Management
Reads retention rather than a total.
Frequently Asked Questions
Which models can I use this on?
Any model that has a start-date field and an end-date field. The view type is added to the framework itself, so it is available everywhere - you decide where to declare it.
Do I get a ready-made cohort screen after installing?
No, and that is deliberate. This module contributes the view type; you declare where it applies. A separate example module ships a worked reference.
What is the difference between retention mode and churn mode?
They are two readings of the same data and complement each other to 100%. Retention shows the share of a cohort still active at each offset period; churn shows the share that has left.
What happens if I mistype an attribute in the view?
The view is refused when it is saved, with a message naming the attribute, the value you gave, and the values it accepts.
Which Odoo version and editions does it support?
Odoo 19.0 - Odoo Community Edition and Viindoo. Upgrades to a newer Odoo series are a separate purchase for that series.
What works well with it?
Web Gantt (viin_web_gantt): the other Enterprise view brought to Community. Sankey View (viin_web_sankey): a flow-diagram view type on the same declaration model. Viin Sale Sankey (viin_sale_sankey): a worked example of a Community analytics view on sales.
Can I try it before buying?
Yes - the Live Preview button at the top of this page opens a worked cohort example on a working database.
How do I get support?
Write to apps.support@viindoo.com with your Odoo version and the technical name viin_web_cohort; pre-sales questions go to sales@viindoo.com.
See Viin Cohort View in Action
or use the Live Preview button at the top of this page
Need help with Viin Cohort View?
For questions, implementation support or a custom feature, contact Viindoo.
Pre-Sales & Partnership
sales@viindoo.comUpgrades to a newer Odoo series are a separate purchase for that series.
All Viindoo apps: Viindoo Apps
Technical Requirement
web onlyChanges log
0.1 - Latest on the 19.0 line
- Restore cog menu and searchbar.
- Fix xlsx export and vertical scrolling in the cohort table.
Viin Cohort View
viin_web_cohort does not add a menu, a button, or a business screen of its own. It adds a new backend screen type called Cohort (technical name viin_cohort) that other modules use to show a retention or churn table on one of their own models. This guide is written for the person who configures or extends an Odoo module - a functional consultant or an Odoo integrator - who wants to add a Cohort screen to a model, understand what each control on that screen does, and read the resulting table correctly.
If you are looking for one specific Cohort screen (an Opportunities analysis, a subscription churn report, and so on), that screen belongs to the app that ships it, not to this module. Once that app is installed, open its own menu to find the screen.
Installation
viin_web_cohort only depends on the base Web module, which every Odoo database already has. In practice you never install viin_web_cohort on its own:
- It is hidden from the Apps list.
- It is installed automatically the moment you install an app that ships a Cohort screen - for example the CRM app's Opportunities analysis, or the Sales, Stock, and Subscriptions apps' enterprise reports.
To confirm it is installed, turn on developer mode, open Settings ‣ Technical ‣ Apps ‣ Modules, and search for viin_web_cohort.
Configuration
Adding a Cohort screen to a model is done by an integrator editing that model's view, not by an end user through the interface. This section documents the contract that view must follow.
The Cohort view element
A Cohort screen is declared as a view whose content is a single <viin_cohort> element - it never contains any child element. The following example, taken from this module's own test data, adds a Cohort screen to a simple sales-order-like model:
<record id="sale_order_test_view_viin_cohort" model="ir.ui.view">
    <field name="name">sale.order.test.view.viin.cohort</field>
    <field name="model">sale.order.test</field>
    <field name="arch" type="xml">
        <viin_cohort string="Sale Order Test Cohort Analysis"
            start_date="date_start" stop_date="date_end"
            interval="month" mode="retention" measure="partner_id"/>
    </field>
</record>
Saving the view raises an error immediately if a required attribute is missing, if an attribute outside this list is used, or if mode, timeline, or interval holds a value outside the sets listed below.
Required attributes:
- string - the title shown above the table.
- start_date - the date field that puts a record into a starting-period row (for example the date an order or an opportunity was created).
- stop_date - the date field that marks when a record leaves that cohort (for example the date it closed or was lost).
Optional attributes - each may be left out, and each has a documented default. What is refused is a value outside its set, not the absence of the attribute:
- mode (default retention) - retention shows what share of the starting group is still open at each later period; churn shows the reverse, the share that has already left.
- timeline (default forward) - forward reads periods from the starting period onward; backward reads them counting down to today.
- interval (default month) - the width of each period: day, week, month, or year.
- measure - what is counted or summed per cell. Leave it out for a plain record count. Set it to any summable field on the model (its own aggregation - sum, average, and so on - is reused); pointing it at a relation field (a partner, a salesperson) counts the distinct number of related records instead. Unlike the three above, measure is a field name, not a closed set.
Usage
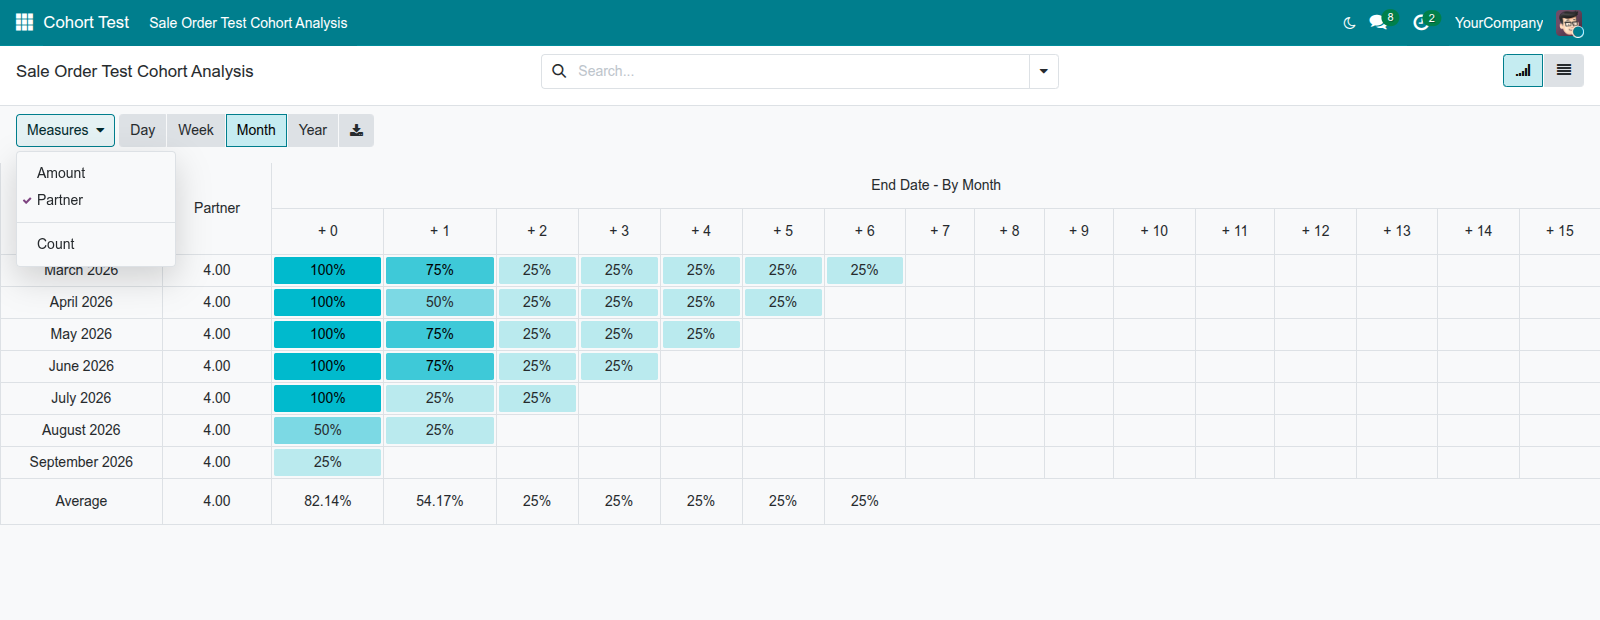
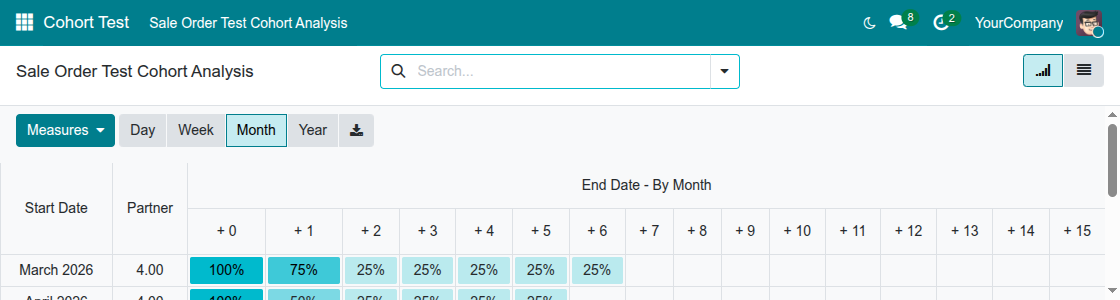
The screens below are captured from the test_viin_web_cohort module's own demo screen (Cohort Test ‣ Sale Order Test Cohort Analysis, reached from the home menu), used here only to illustrate what a Cohort screen looks like once a module declares one. Installing viin_web_cohort by itself does not add this menu.
Reading the table
Each row is one starting period (grouped by the start_date field, at the current interval). The first two columns show the period and the measure's total for that period. Each following column is an offset from the starting period (+0, +1, +2, and so on) and shows the percentage of the starting total that is still retained - or, in churn mode, that has already left - by that later period. Each cell is shaded in the accent color at an opacity equal to its percentage, so the more strongly colored a cell is, the higher its percentage. A bottom Average row averages every column across all the rows above it.
Choosing what to measure
Click Measures to pick what each cell counts. The list always includes Count (a plain record count) plus every other summable or relational field the view's measure attribute could point to on that model.
Switching the time interval
The Day, Week, Month, and Year buttons re-group both the rows and the columns at that interval width. The choice is remembered if you leave and come back to the screen.
Drilling into a cell
Click any percentage cell, or a row's starting-period label, to open the underlying records for that row and column combination in a regular list, which you can open individually from there.
Exporting to Excel
Click the download button next to the interval switcher to download the table exactly as shown (every row, every percentage, and the Average row) as an .xls file named after the screen's title.
Troubleshooting
"<viin_cohort> requires the '...' attribute" - one of string, start_date, or stop_date is missing from the view. Add it and save the view again.
"Invalid attributes (...) in viin_cohort view" - the view uses an attribute this element does not accept, often a typo. Only string, start_date, stop_date, mode, timeline, interval, and measure are allowed.
"Invalid mode/interval/timeline (...) ..." - the screen tried to load with mode, timeline, or interval empty or set to a value outside its allowed set - most often because the view left that attribute out entirely. Set it to one of the values listed in Configuration above.
The screen shows "No data available" - either no record matches the current filters, or the chosen measure has nothing to aggregate for those records. Clear filters or pick a different measure.
A cell shows a dash instead of a percentage - that period is still in the future relative to today, so there is nothing to report yet.
FAQ
Can I put a Cohort screen on any model? Yes, as long as the model has two date fields you can use as the starting and the stop date.
Can an end user configure the Cohort screen from the interface? No. Which fields are used and which values are allowed is fixed in the view's definition; end users only choose the measure and the interval while viewing the screen.
Why does my app not show a Cohort screen even though ``viin_web_cohort`` is installed? Because viin_web_cohort only provides the screen type. A specific app has to declare its own <viin_cohort> view and add it to one of its own menu actions before a Cohort screen appears anywhere.
Does the export include the drill-down records? No. The exported .xls file mirrors exactly what is on screen - the cohort rows, the percentages, and the Average row - not the individual records behind any cell.
This software and associated files (the "Software") may only be used (executed, modified, executed after modifications) if you have purchased a valid license from the authors, typically via Odoo Apps, or if you have received a written agreement from the authors of the Software (see the COPYRIGHT file).
You may develop Odoo modules that use the Software as a library (typically by depending on it, importing it and using its resources), but without copying any source code or material from the Software. You may distribute those modules under the license of your choice, provided that this license is compatible with the terms of the Odoo Proprietary License (For example: LGPL, MIT, or proprietary licenses similar to this one).
It is forbidden to publish, distribute, sublicense, or sell copies of the Software or modified copies of the Software.
The above copyright notice and this permission notice must be included in all copies or substantial portions of the Software.
THE SOFTWARE IS PROVIDED "AS IS", WITHOUT WARRANTY OF ANY KIND, EXPRESS OR IMPLIED, INCLUDING BUT NOT LIMITED TO THE WARRANTIES OF MERCHANTABILITY, FITNESS FOR A PARTICULAR PURPOSE AND NONINFRINGEMENT. IN NO EVENT SHALL THE AUTHORS OR COPYRIGHT HOLDERS BE LIABLE FOR ANY CLAIM, DAMAGES OR OTHER LIABILITY, WHETHER IN AN ACTION OF CONTRACT, TORT OR OTHERWISE, ARISING FROM, OUT OF OR IN CONNECTION WITH THE SOFTWARE OR THE USE OR OTHER DEALINGS IN THE SOFTWARE.