Instructions
Instruction video: Accounting Analysis
1. Invoice Analysis report
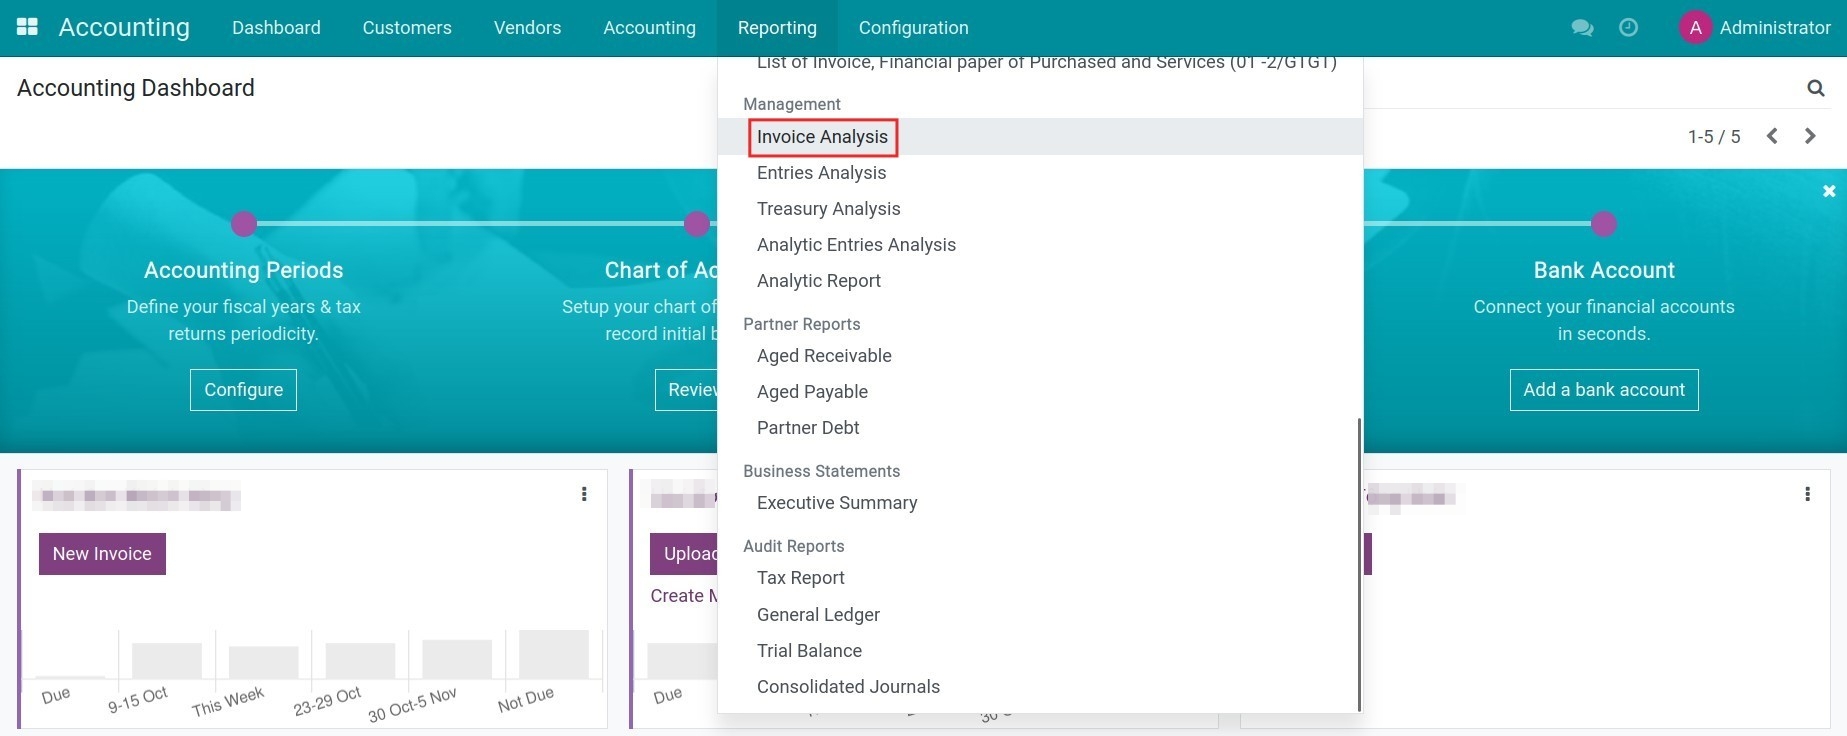
Navigate to Accounting > Reporting > Invoice Analysis, a report analyzing the untaxed total amount of customer invoices in a period is displayed by default.
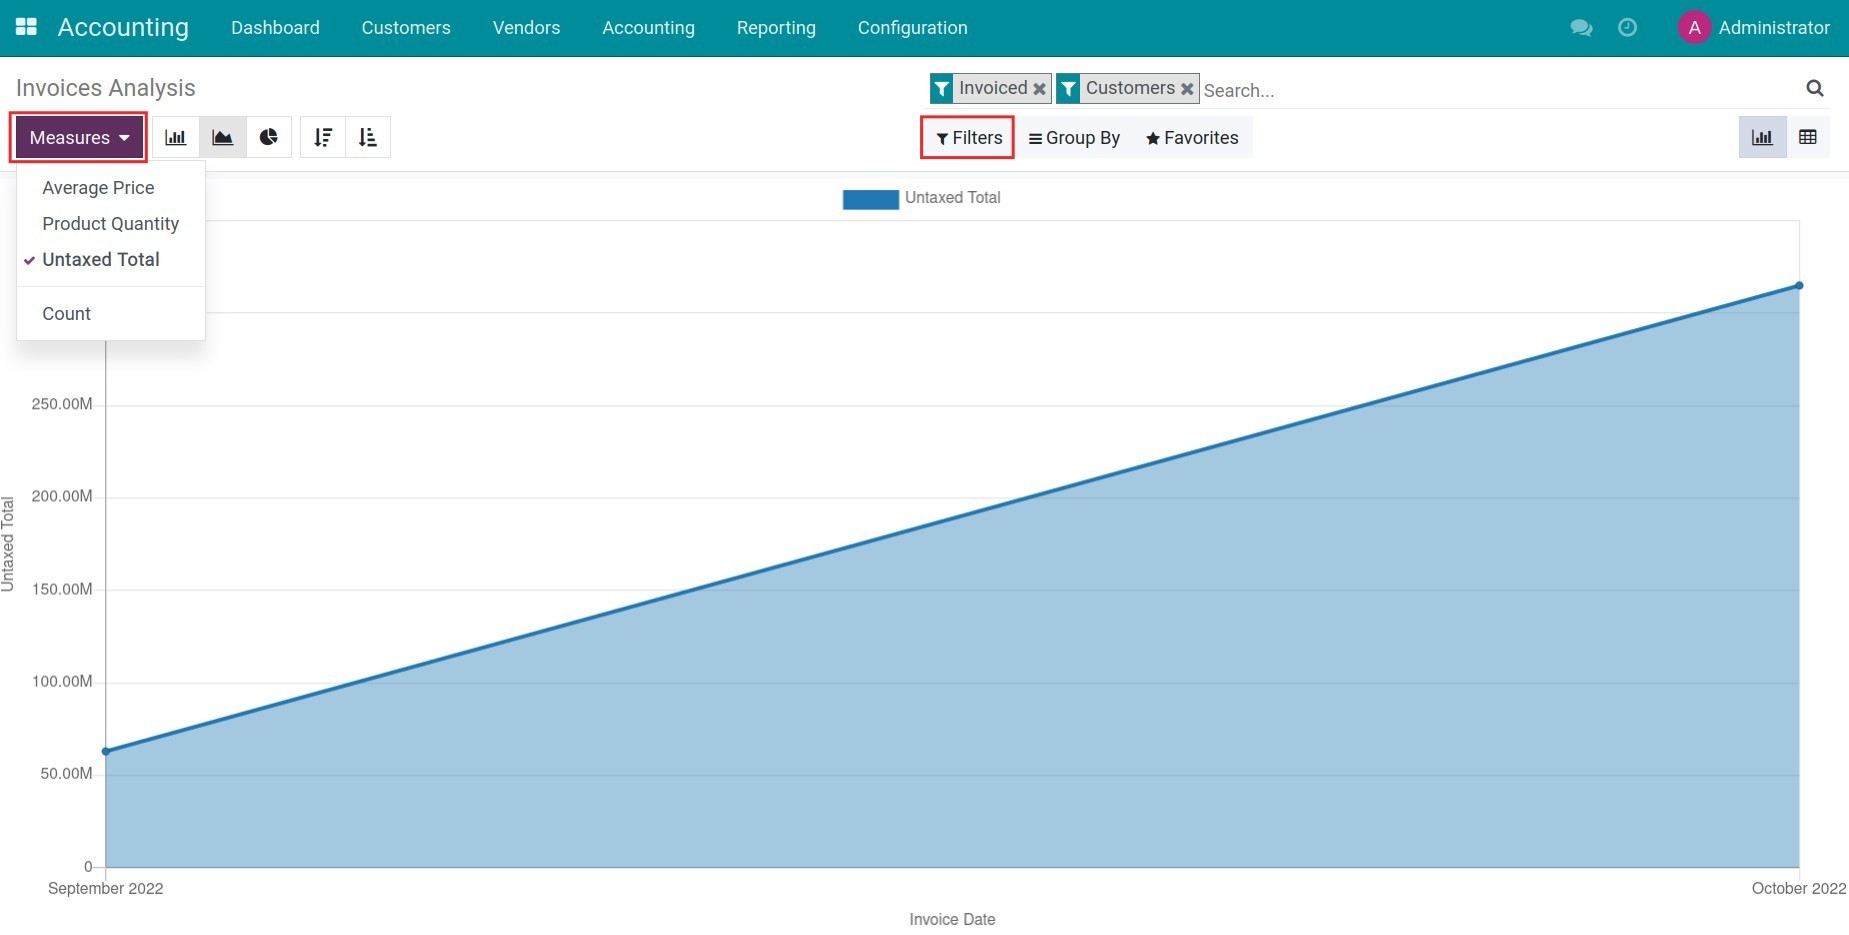
From here, you can add other measures such as Average Price, Product Quantity, etc., or use default filters to search for certain invoice types such as by customers, vendors, invoice status, etc. To switch to the pivot view, click on the respective icon.

2. Entries Analysis report
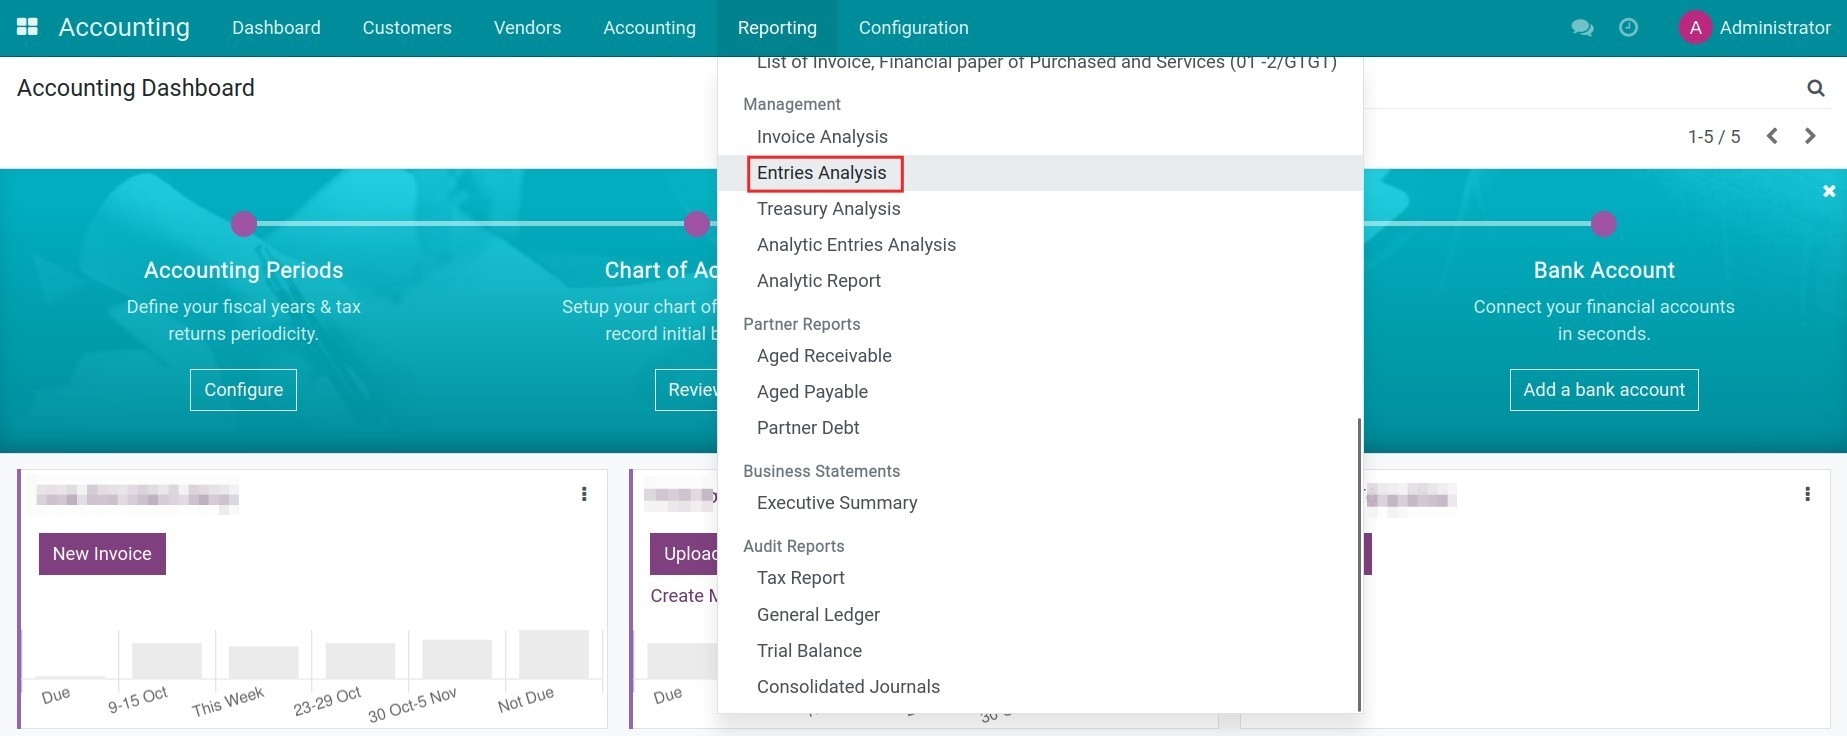
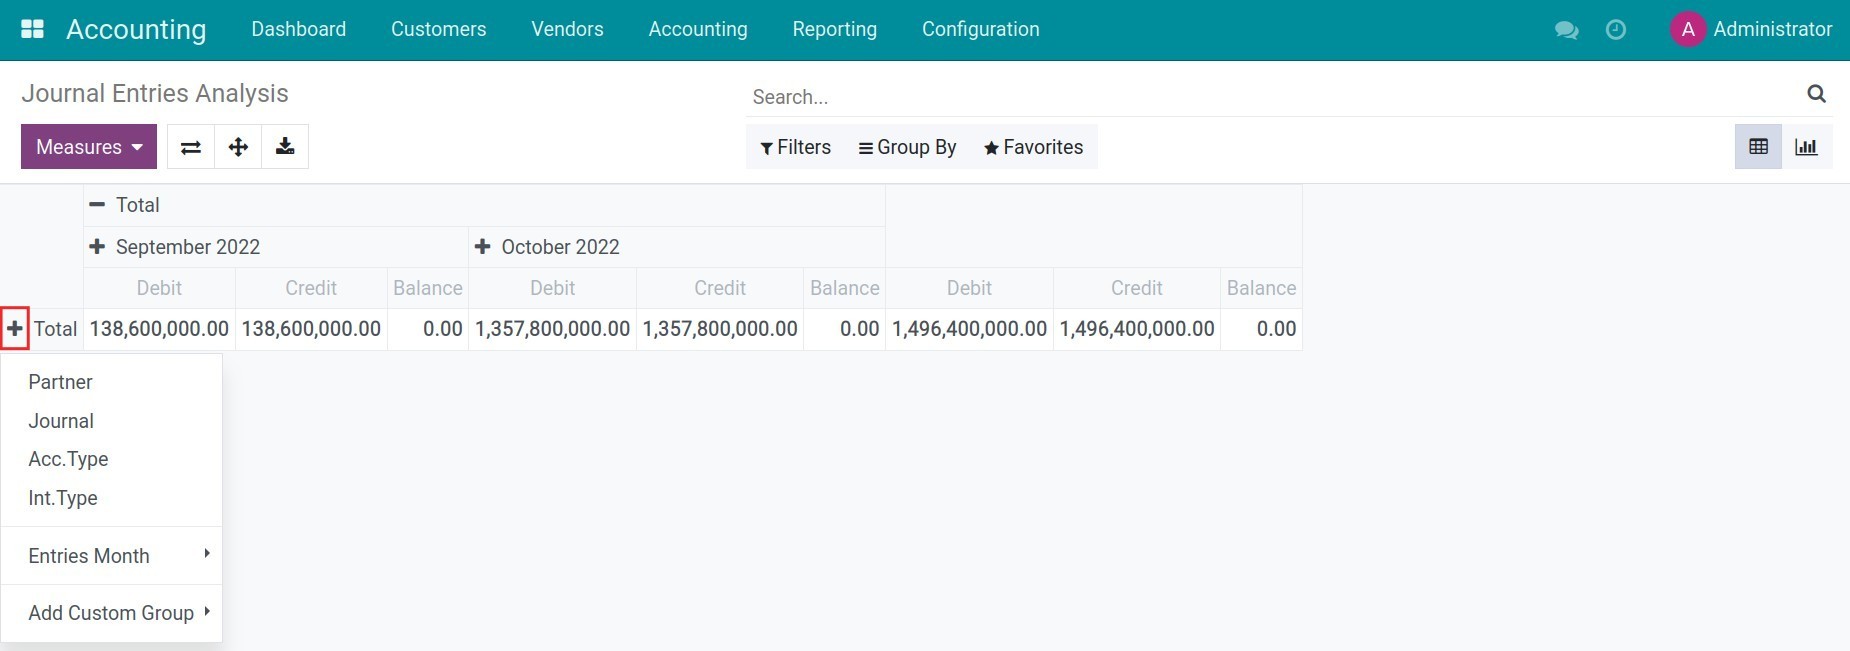
Navigate to Accounting > Reporting > Entries Analysis to see the pivot entries analysis of each accounting type in a period.
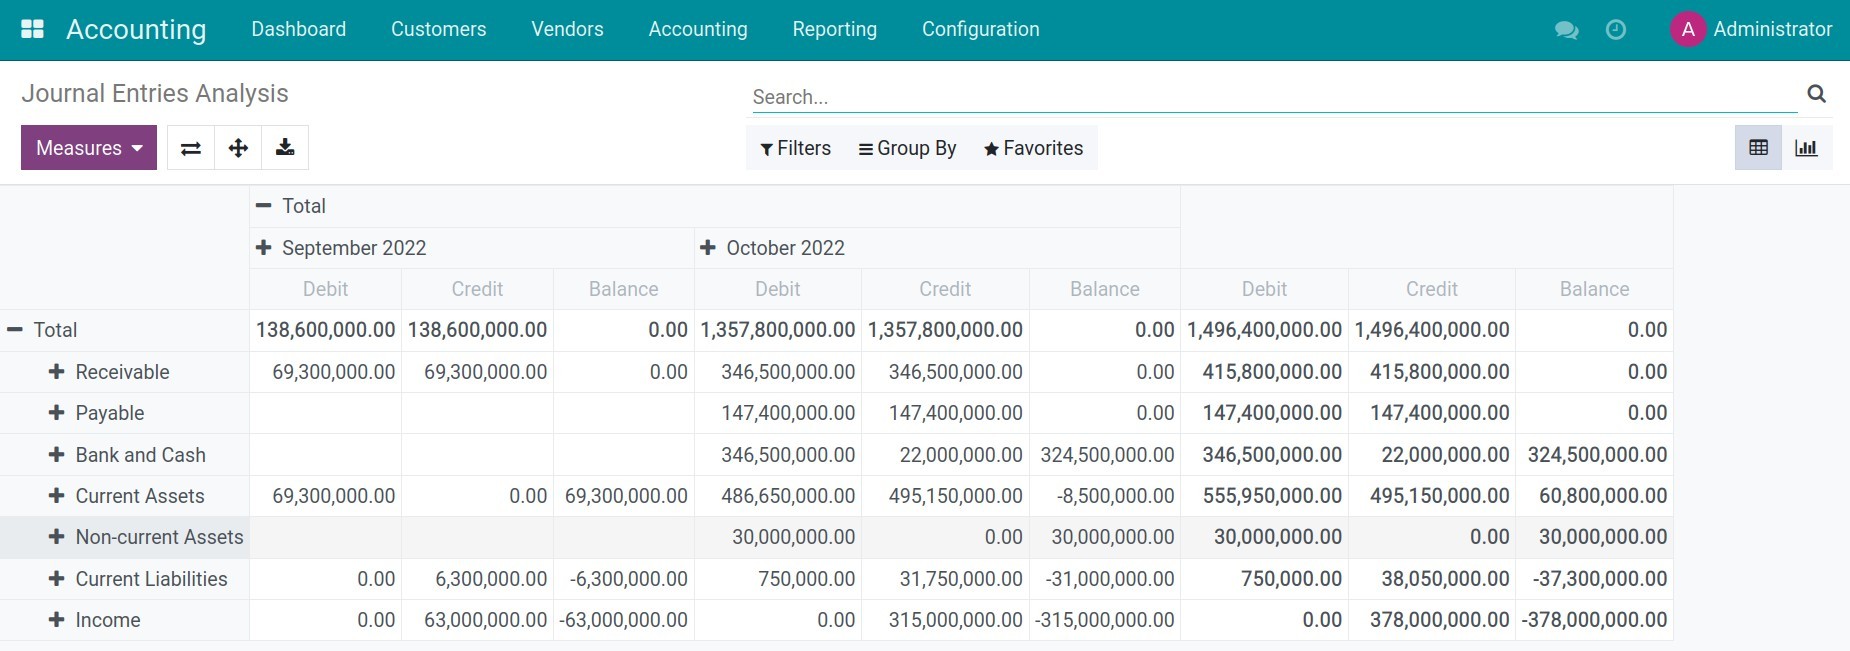
In this report, you can select other measures such as Amount Currency, Products Quantity, etc., or other filtering criteria such as partner entries, journal, internal type, etc. by clicking on the + symbol.
3. Treasury Analysis report
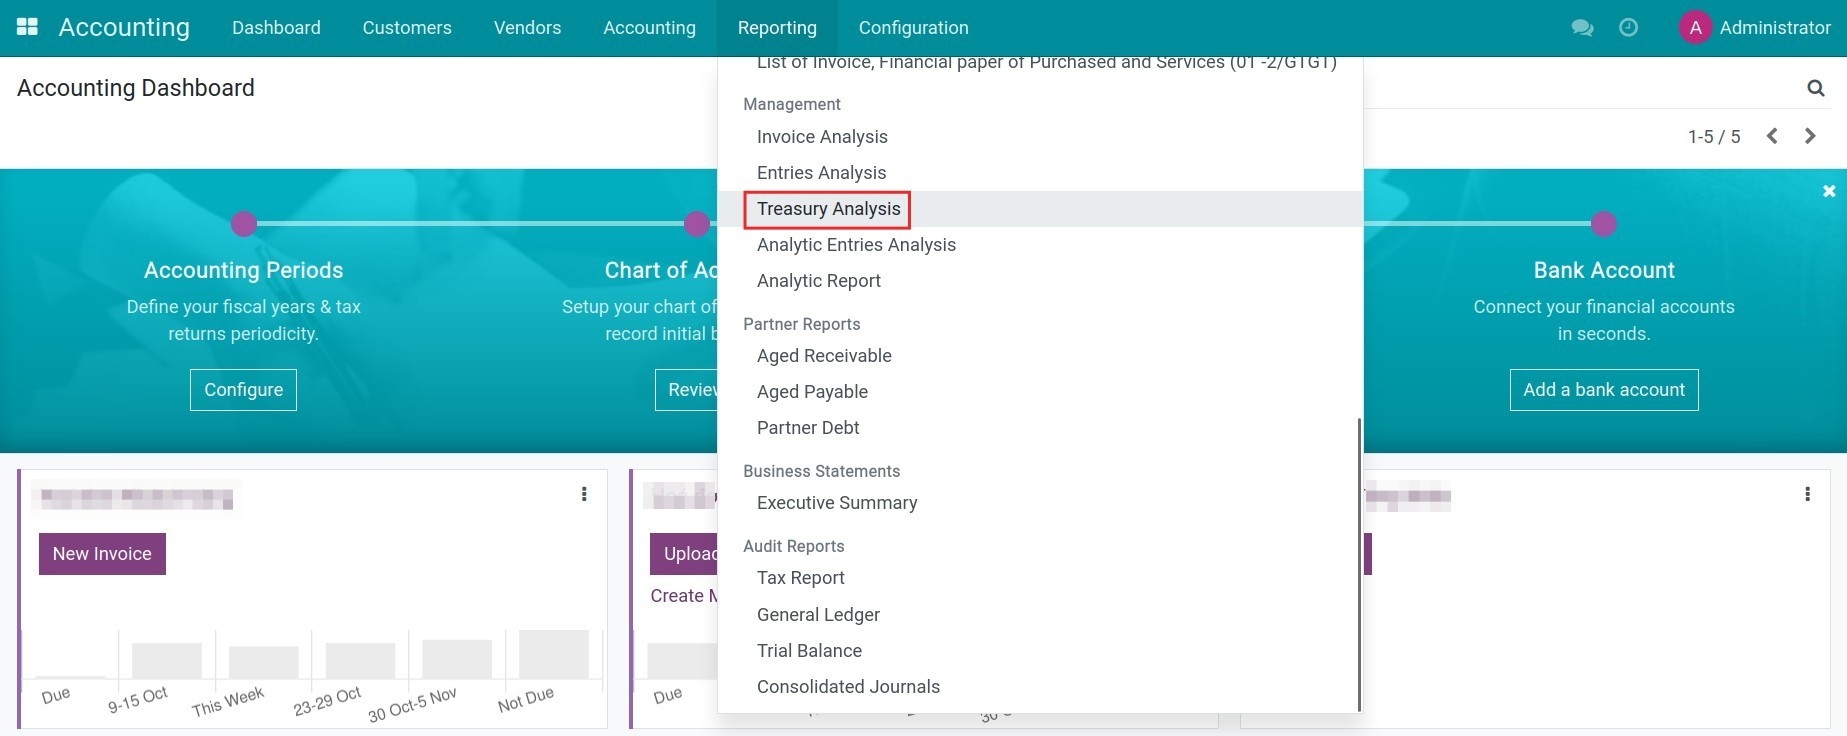
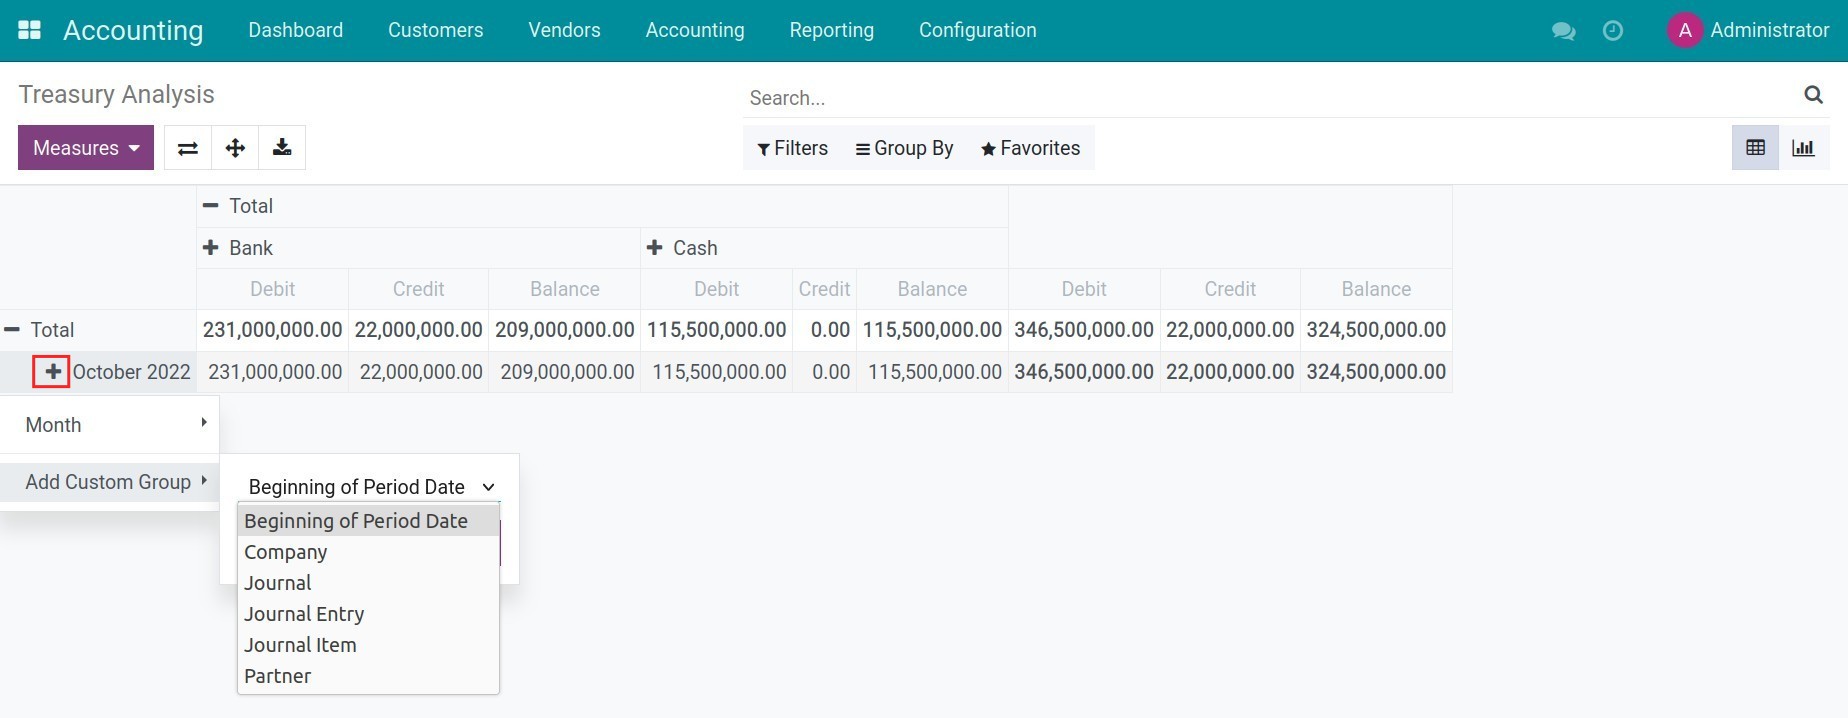
Navigate to Accounting > Reporting > Treasury Analysis, the incoming and outgoing flow in cash or through bank accounts of your company in a period of time is displayed in the pivot view by default.

Here you can add some other measures such as Count to display the number of payments received or made by the company. Besides, other filtering criteria such as journal entry, partner, journal, etc. can be easily added by clicking the + symbol.
Note: Viindoo Accounting software supports analysis reports in other graph views such as bar charts, pie charts, line charts, and stacked bar charts.